
The History of Australian House Prices & Affordability
Weekly Real Estate Market Update with Leigh Martinuzzi MPG
Dwelling prices continue to lower this week as we head into spring. Consumer confidence wanes while Australia’s house prices remain at an all-time high. The good news is, that it’s looking as though the current downturn might be short and sharp. I had the privilege of heading John McGrath speak this week who felt Sydney is now reaching the bottom of the market with an expected downturn period to be around 12 to 18 months. According to McGrath, Sydney’s prices started slowing in November 2021, which was earlier than what we experienced here on the Coast with prices starting to falter around May 2022.
Overall, across our capital cities, prices are down -1.0% over the last month and still up 1.0% year on year. Brisbane prices are down by -1.9% over the past 28 days and still up 16.2% over the past 12 months. On the Sunshine Coast, we have experienced a similar downturn in prices as compared to Brisbane. Although some vendors are holding firm with their asking prices, we are starting to see a few houses being listed for what many would consider aggressive pricing. Due to the uncertainty in the current environment, we are finding many homeowners hesitant to sell. This is reducing the number of suitable properties available for those buyers that are ready to purchase. And yes, there are still buyers keen to get into a new home.
Over the next 6 months, we will see the market activity improve albeit not like that of 2021. I also feel prices will fall back slightly, however, will then begin to rebound. The rebound won’t be at a rapid rate as what we’ve just experienced but it will mean prices will stabilise and start climbing slightly. We’ve seen good auction clearance rates in both Melbourne and Sydney last week and a record number of homes being put up for auction this week coming. This is a sign that things are starting to improve in our southern states with lag time here likely 6 months, give or take. With less buyer demand and urgency, we will see the time it takes to sell properties return to pre-covid levels of about 30 to 60 days in many areas on the Sunshine Coast.
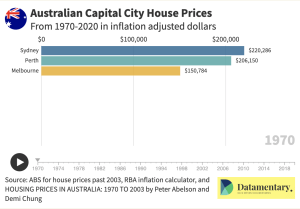
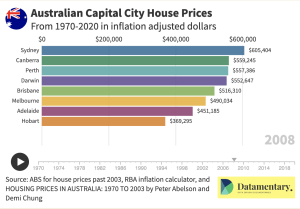
Let’s talk about affordability. And I will summarise these points with a few charts for you to view (Figures based on ABS data). In 1970 the median house price in Sydney was a mere $18,700. In 2020, you’re looking at a bit over $1.15M. Now looking at the chart with the inflation-adjusted figures the same house in 1970 in today’s dollars is worth just over $220,000. Meaning you could afford to buy 5 houses as opposed to just one. Keep in mind these median prices have changed significantly in the last two years during the COVID boom. It does however highlight relative affordability and how much it has shifted.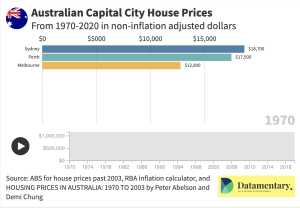
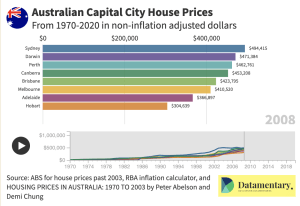
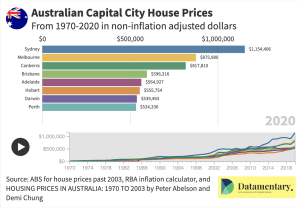
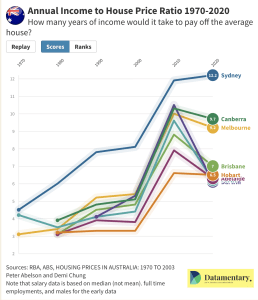
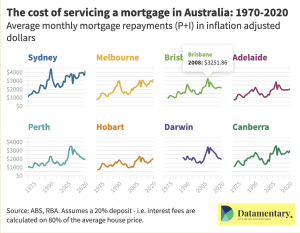
The other thing to consider is how average wages affect current affordability. In 1970, the average wage was $4,100 per week. In Sydney, this would have meant the average house cost 4.5 times your pre-tax income. You can see with today’s market to buy a house in Sydney you are looking at a rate of 12.2 times your pre-tax income. A fairly notable difference. And although the interest rates are rising in the short-term, average mortgage repayments are not nearly as high as they were back in 2008. So although we are paying more for our properties, our repaymentsare relatively stable. I’ve added some median house prices for the Sunshine Coast in here too just for comparison. Records back to 2008 show the average house price on the Sunshine Coast was $419,000 and by 2020 they rose to $617,000 on average. And now, with another boom behind us, you’re looking at median house prices of closer to $1M.
One thing that is consistent is that prices continue to climb over the long-term. Buyers have a grand opportunity to enter the market right now while the intensity and buyer demand is less. It won’t be long and we will see prices start to climb once again.
AUCTION CLEARANCE RATES – WEEK ENDING 21st OF AUGUST 2022
- Queensland – 34% (217/1221)
- NSW – 56% (849/1427)
- Victoria – 60% (820/1137)
- ACT – 55% (100/98)
- South Australia – 67% (113/298)
- Tasmania – 100% (2/156)
- Western Australia – 25% (16/668)
- Northern Territory – 100% (1/33)
*(Auctions/Private Sales)
REVIEW OF THE WEEK
GREAT AGENT
Leigh is clearly a professional and knows the market extremely well. I felt like I was in safe hands. His history and sales record speak for themselves. Going with Leigh is a pretty safe bet :). – Hunchy Seller