The End to the Long-Term BOOM?
By Leigh Martinuzzi
An interesting article I read this week explained why we can expect a slowing to the current booming property market we’ve been seeing. You can find a link to this article using the link below. What I found interesting is that the current market is considered a long-term boom market in which we’ve had three of these in the last 100 years. The last one ran for 30 years (1946 to 1976) before entering a considerable long-term bust market for almost as long.
We often look at the past year as being the major boom period however, this is just one of a few over the last 30-year long-term boom market. This year we’ve seen national property prices rise 22.2% to the end of November, with some areas like Brisbane and even more so regional areas like the Sunshine Coast seeing house prices grow 25% and above. However, since 1997, the start of the long-term boom market, we’ve seen prices rise 317% while wages over the same period have only grown 106%.
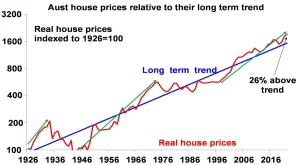
The chart below highlights the past 100 years of property price growth in Australia. The green lines indicate the long-term boom markets while the gaps in-between show the long-term bust markets. Real property price growth over the last 100 years has an average return of 3% per annum, which is aligned with long-term average real GDP.
Slow wage growth combined with worsening affordability may be a sign for soon to be noticed declining market. Housing affordability is one of the main factors contributing to the current softening market. Experts are suggesting a considerably slower market in 2022, with price growth forecasts of 5% to 6% following a declining market in 2023 where house prices may fall 5% to 10%. And if history repeats itself we may see a couple of decades of zero growth while wages and the nation’s economy re-stabilise.


