
Two Markets, Two Speeds: Why Regional Queensland Is Holding Its Ground | Chart Pack August 2026
By Leigh Martinuzzi of Martinuzzi Group – eXp Realty | Sunshine Coast Real Estate
Back in January I wrote that 2026 was starting with cautious optimism but not without headwinds. Seven months on, I think it is fair to say the headwinds won.
The August data landed last week. It is the most sobering set of numbers I have read in a while.
National home values are falling. Every major capital city is going backwards over a rolling four week period. Auction clearance rates have not cracked 50% since May.
And yet, if you only read the annual growth figure, you would think the market was still booming.
That gap is the whole story this month. The yearly number says one thing. The last three months say another.
So let us walk through it properly. Then we can bring it back to what it may mean for us here on the Sunshine Coast.
The August numbers, in a nutshell
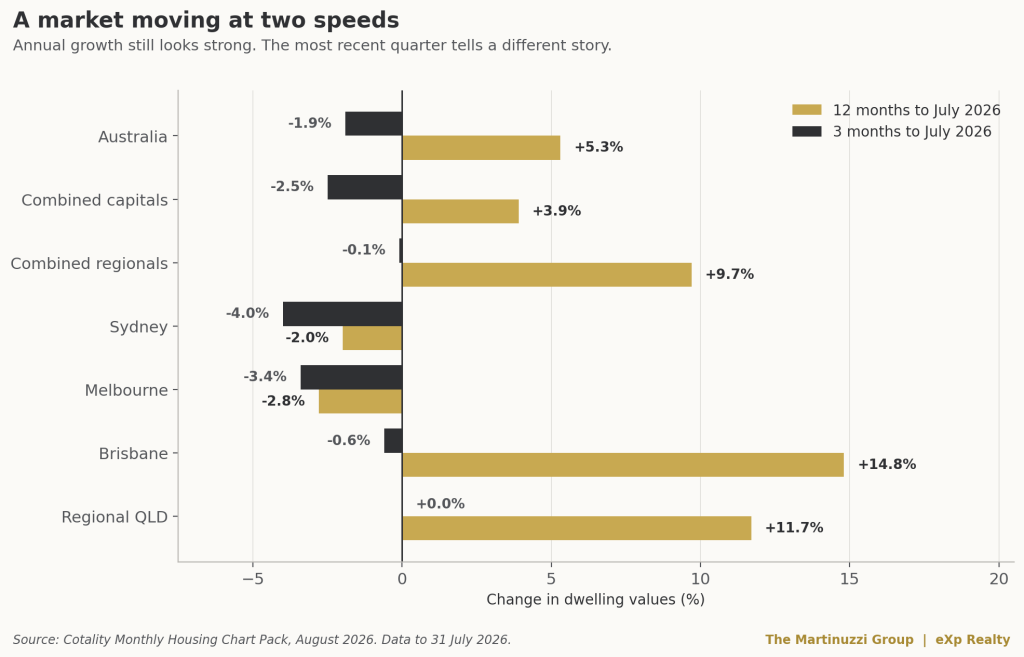
Cotality’s August Housing Chart Pack shows national dwelling values fell 1.9% over the three months to July 2026.
Across the combined capital cities, values dropped 2.5%. Combined regional markets held far steadier at -0.1%.
Now here is the figure most headlines quote. Over the twelve months to July, the national median dwelling value was still up 5.3%. That added roughly $49,200 to the median Australian home.
Both numbers are accurate. They simply measure different things.
Why the annual figure and the quarterly figure disagree
This is worth understanding. It changes how you read almost every property headline you will see this year.
An annual growth figure covers twelve months. That window still includes the strong second half of 2025 and the early part of 2026. Values were climbing quickly back then.
So the annual number is partly a record of a boom that has already finished.
A quarterly figure only covers the last three months. It gives you a much closer read on current conditions.
When the two numbers point in opposite directions, the quarterly one usually tells you where things are heading.
Brisbane is the clearest example. Values there rose 14.8% over the year, which sounds excellent. But the market slipped 0.6% over the quarter. It now sits just below its May 2026 peak.
It also works the other way. This is where I see people get unnecessarily worried.
A negative annual figure for a suburb does not always mean homes there are selling for less than last year. Sometimes it reflects a change in the mix of properties that sold. Sometimes it is a small sample in a small suburb.
Check what sits underneath the percentage before you draw conclusions about your own home.
Why inflation has been so hard to shift
Before we get to rates, it helps to understand why they went up again. This cycle has very little to do with our housing market.
In his recent economic update, Michael Yardney pointed to the US and Israel conflict with Iran. He called it the biggest global shock in years.
Oil prices have surged. Asia has felt the effects most sharply, because around 80% of its oil imports pass through the Strait of Hormuz. Those countries are Australia’s largest trading partners.
Yardney also noted that the IMF now describes global disinflation as having stalled. In plain terms, prices are no longer cooling the way they were.
The IMF projects world growth at 3.0% for 2026. The OECD expects growth to ease from 3.2% last year to 2.9% this year. Both the World Bank and the IMF put global headline inflation near 4%.
So a good chunk of the inflation keeping our rates high came from overseas. That is worth remembering when you read commentary blaming the RBA alone.
Interest rates are still the engine
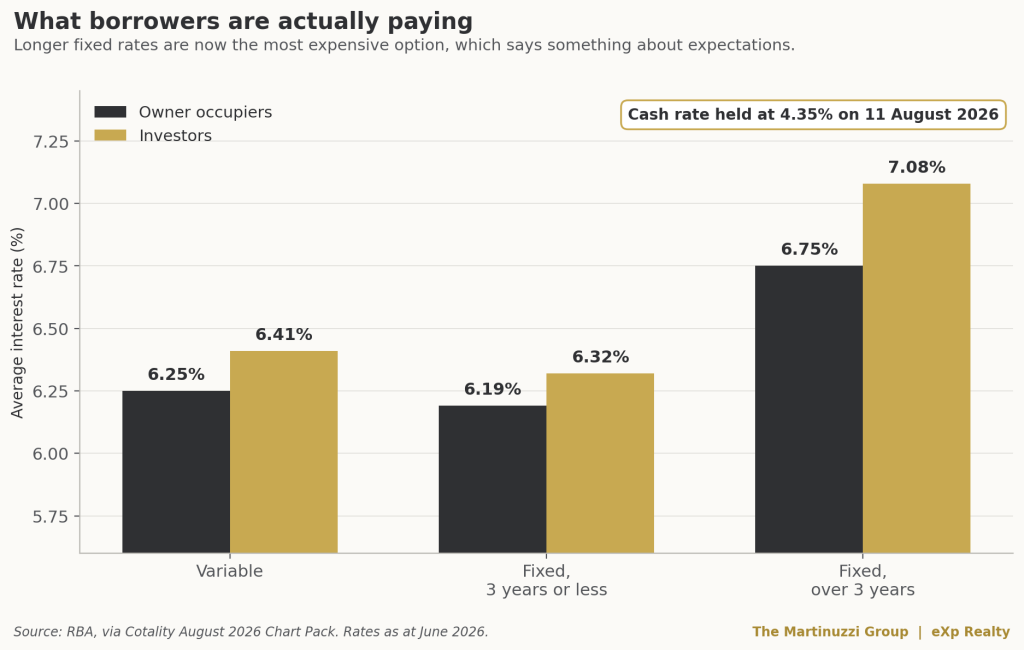
The Reserve Bank held the cash rate at 4.35% on 11 August 2026. That was its second hold in a row.
Three rate rises came before it, between February and May. Together they lifted the cash rate from 3.60% to where it sits now.
Headline inflation has eased to 3.8%, down from an April peak of 4.2%. The RBA’s preferred trimmed mean measure has been more stubborn at 3.6%.
Governor Michele Bullock made the board’s position clear. It remains concerned about the inflation outlook. She expects a period of subdued growth will be needed to bring inflation down for good.
What the rate rises have cost buyers
Two figures matter most to households here.
A buyer with the average new owner occupier mortgage of $735,000 now pays just over $350 more each month. That is purely down to this year’s rises.
A median income household has also seen borrowing capacity fall by 7.0%. In dollars, that is more than $53,000.
That second number is quietly reshaping the market. Buyers who can borrow $53,000 less do not stop buying. They simply buy differently.
A word on fixed rates
Long term fixed loans are currently the most expensive option on the board. Owner occupiers are looking at 6.75%, investors at 7.08%.
Lenders are not pricing those loans cheaply. That tells you something about how long they expect high rates to last.
Michael Yardney takes a more optimistic view. He points out that three of Australia’s four big banks now believe we have reached the peak. They expect cuts to begin in 2027.
The RBA has been careful not to rule out another rise if inflation surprises again. Both positions are reasonable. Neither is a certainty.
Where the pressure is landing hardest
Here is the detail I found most useful this month. Almost nobody reports it.
The downturn is not hitting all price points equally.
Nationally, values in the cheapest quarter of the market are up 10.8% over the year. The most expensive quarter has managed just 0.7%.
Look at the last quarter alone and the split is even clearer. Sydney’s most expensive 25% of homes fell 5.2%. Its cheapest 25% fell only 1.4%.
In Brisbane, the entry level quarter of the market actually rose 0.5%. The top quarter fell 1.2%.
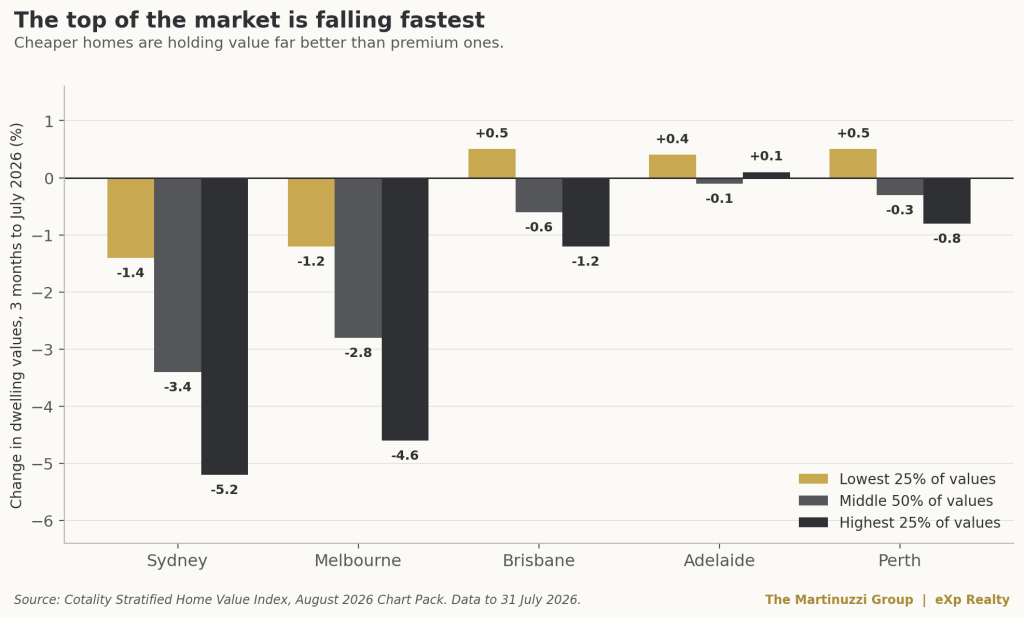
The logic is straightforward. When borrowing capacity tightens, demand does not disappear. It moves down the price ladder.
Affordable homes pick up buyers who can no longer reach the next bracket. Premium homes lose the buyers who were stretching to get there.
Selling a higher end home this year? Factor that in early. It is better than discovering it six weeks into a campaign.
What this means here on the Sunshine Coast
Cotality does not publish a Sunshine Coast line in this particular chart pack. The closest reliable read we have is regional Queensland, with Brisbane as broader South East Queensland context.
Treat these as a guide for our area rather than an exact match.
On that basis, regional Queensland is holding up much better than the national picture.
Values were flat over the quarter at 0.0%. Nationally values fell 1.9%, and across the capitals they fell 2.5%. Over the year, regional Queensland is still up 11.7%.
But flat is not the same as unchanged. The conditions underneath have shifted noticeably.
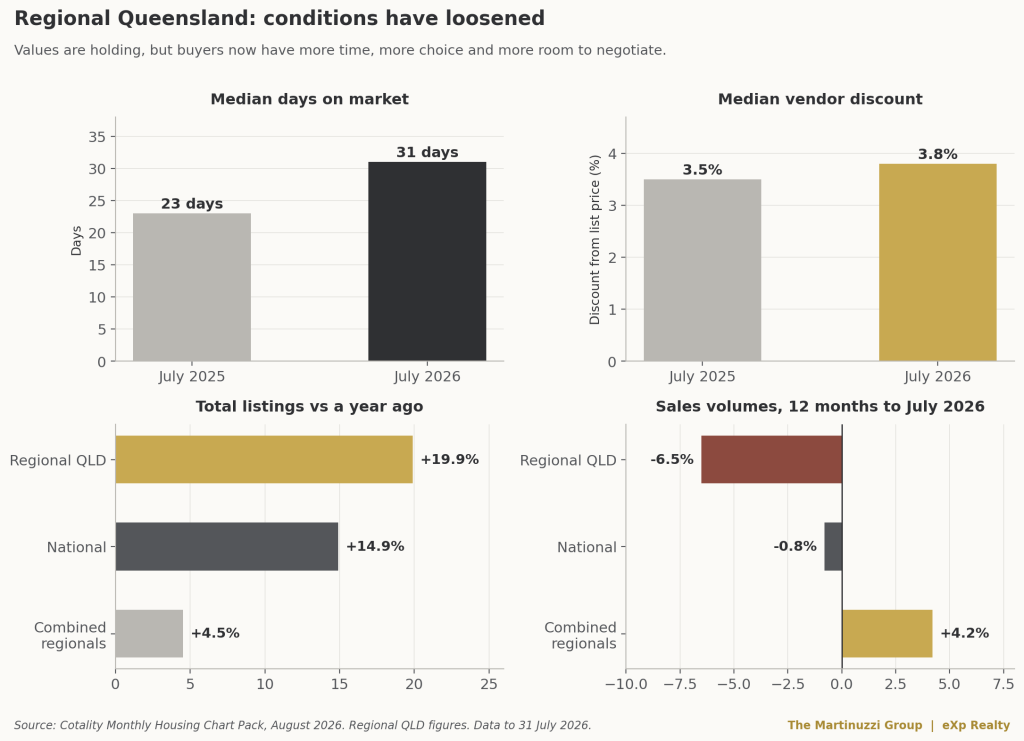
Four things stand out.
Homes are taking longer to sell. The median time on market across regional Queensland went from 23 days a year ago to 31 days now. That is an extra week and more, and it is one of the sharper changes in the country.
Buyers are negotiating harder. The median vendor discount widened from 3.5% to 3.8%. On a $1 million home, that difference is roughly $3,000, which sounds small until you realise it is the direction of travel that matters, not the size of the step.
There is far more competition. Total listings across regional Queensland are up 19.9% on a year ago, well above the national increase of 14.9%. Cotality is explicit that this build up reflects easing buyer demand rather than a flood of new stock, which is an important distinction.
Fewer sales are happening. Sales volumes fell 6.5% over the twelve months to July, at a time when regional markets nationally rose 4.2%.
That is a market where values are holding but the pace has genuinely changed. It matches what I have been seeing locally across Palmwoods, Woombye, Nambour, Burnside, Coes Creek and Mooloolah Valley. Well presented, sensibly priced homes are still finding buyers. Homes priced on last year’s momentum are sitting.
One more local angle worth knowing. Rents across regional Queensland rose 6.4% over the year, comfortably ahead of wage growth at 3.3%, while gross rental yields sit at 4.2% compared with 3.6% across the capitals. For anyone weighing up whether to sell or hold an investment property, the income side of the equation has quietly improved.
What it may mean for you
If you are a homeowner with no plans to move, very little here demands action. Your equity position is likely still well ahead of where it was a few years ago, and home loan arrears nationally remain at post GFC lows, which suggests most households are managing. The more useful exercise right now is checking whether your loan is still competitive, given variable rates are sitting around 6.25%.
If you are thinking of selling, this is a market that rewards preparation. With more competition on the market and buyers taking longer to commit, pricing to the current market rather than to last year’s peak may make a real difference to your result. Presentation matters more when buyers have twenty other homes to compare yours against. Timing matters too, and spring listings will be arriving soon.
If you are buying, you have more room than you have had in some time. More stock, longer selling periods and wider vendor discounts all point to better negotiating conditions. That said, your borrowing capacity has also fallen, so getting finance clarity before you start looking is more important than it was twelve months ago. Choice is worth little if you are not clear on what you can act on.
If you are an investor, the picture is mixed but not unattractive. Yields are the highest they have been since April 2023, rents are still climbing faster than wages, and vacancy remains tight. On the other side, investors are paying roughly 0.1 to 0.3 percentage points more than owner occupiers on every loan type, and the federal budget changes are expected to reduce investor lending in coming quarters.
If you are weighing up a move in the next six to twelve months, it may be worth getting a current read on where your property sits before spring listings arrive. No pressure and no obligation, just a clearer picture to work from. Feel free to reach out any time if you would like to talk it through.
Get in touch with us today and and let’s give you fantastic results that you deserve.
SUBSCRIBE to stay up to date with all the latest property insights and news.
Click Here to Subscribe
The Sunshine Coast Seller’s Guide to Choosing the Right Agent
Get Your Free Guide Here
Just Listed Your Home? Here’s What Happens Next (And How to Get Ready for a Great Result)
Download the Guide Here
Data referenced in this article is drawn from the Cotality Monthly Housing Chart Pack, August 2026, with values current to 31 July 2026. Interest rate information reflects the Reserve Bank of Australia’s decision of 11 August 2026. Additional commentary sourced from Michael Yardney, Property Update.