


Regional Queensland Property Market Joins the Downturn
By Leigh Martinuzzi of Martinuzzi Group – eXp Realty | Sunshine Coast Real Estate
Two weeks ago I wrote about Domain’s June quarter figures and made a point that felt safe at the time. The capitals were falling, but regional markets across the country were still rising. The correction, I said, was not playing out in our part of the world.
Cotality’s July Home Value Index, released on 3 August, has changed that. I would rather update my read in public than quietly move on from it, so here is what shifted and what I think it means.
The number that changed
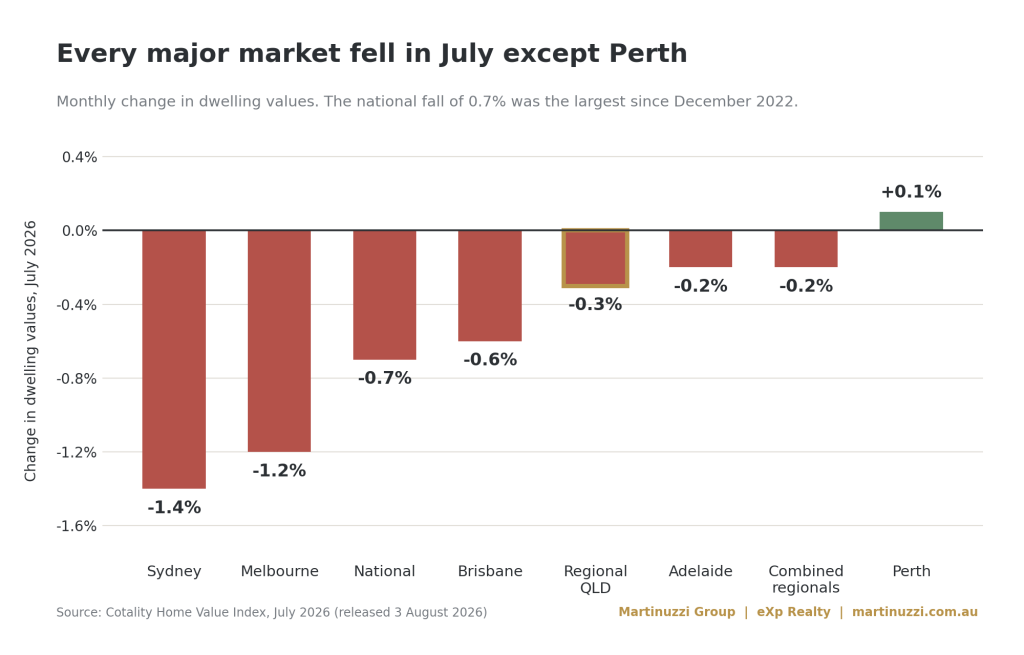
Cotality’s combined regional index fell 0.2% in July. That is its first monthly decline since January 2023.
Regional Queensland was down 0.3%. Regional New South Wales fell 0.4% and regional Victoria 0.3%. Only regional South Australia and regional Western Australia kept rising, at 1.4% and 0.9% respectively.
Brisbane moved too, and further than I expected. It fell 0.6% in July, and revisions to earlier data now show that was actually its second consecutive month of decline. A fortnight ago Brisbane was sitting at a fresh peak. So the answer to the question I left open two weeks ago is that yes, it has reached us. Not with any drama, but it has reached us.
Watch the order these markets turned
Line up the peaks and something useful appears.
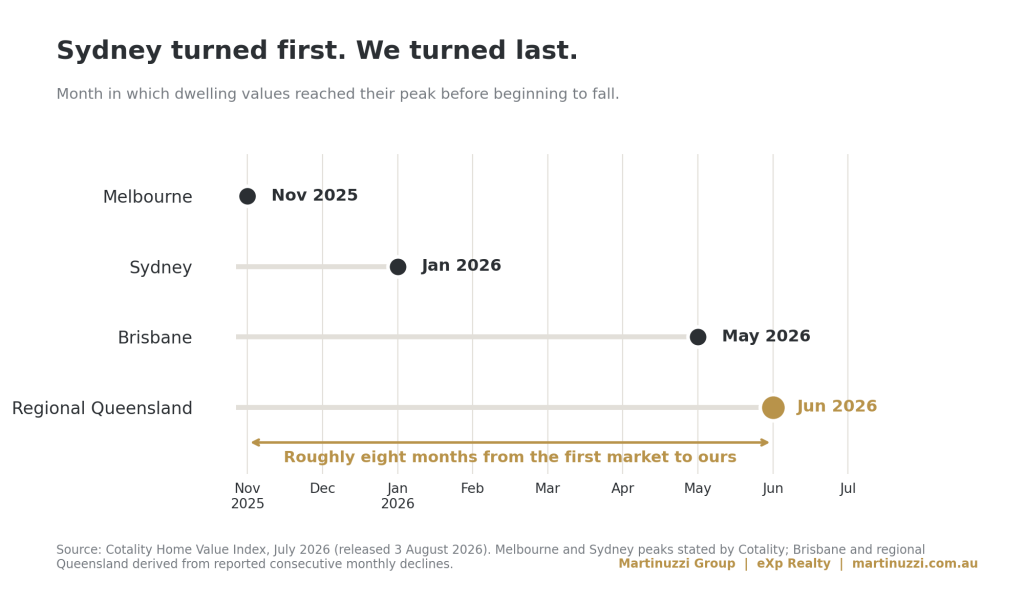
Melbourne peaked in November last year. Sydney reached its high point in January. Brisbane held on until around May. Regional Queensland turned in July.
That is roughly eight months from the first market to the last. The reason is not mysterious. Sydney carries the highest prices relative to incomes anywhere in the country, so when borrowing capacity tightens, it feels the squeeze first and hardest. We tend to feel it later, and so far, considerably more gently.
It is the reason I keep half an eye on southern data even when it seems irrelevant to a Thursday morning in Palmwoods. It is usually a preview.
A word on how confident anyone should be about monthly figures
One detail from the July release deserves more attention than it will get.
Cotality revised Perth’s June result down by 120 basis points, which pushed a city that looked like it was still growing into negative territory for that month. Gerard Burg, Cotality’s Head of Research, described the revisions as a reflection of how quickly conditions are changing across individual markets.
That is a healthy reminder. In a market moving this fast, a single monthly figure is a first estimate, not a verdict. I would treat any one number, including the ones above, as a direction rather than a fact.
The split that actually matters for us
Here is the finding I think is most relevant to anyone living in the Sunshine Coast, and it has nothing to do with geography.
Cotality reported that upper quartile home values fell 3.2% nationally over the three months to July. Across the same period, the lower price tier rose 0.3%.
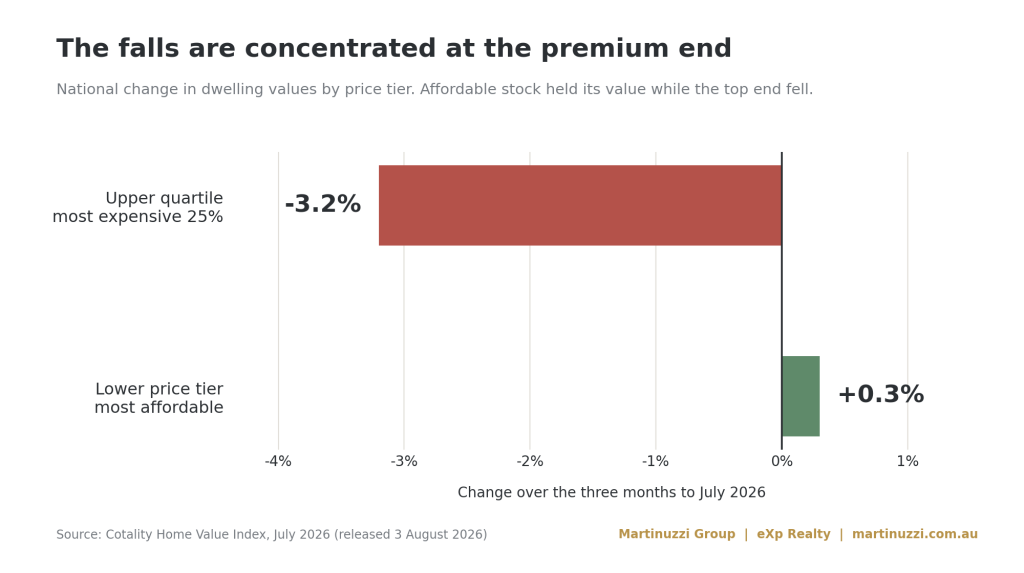
The falls are concentrated at the expensive end of the market. The mechanism is borrowing capacity. Higher priced homes depend on larger loans, so when lending capacity tightens, that is where the pressure lands first and hardest.
For the hinterland, that is worth knowing. Suburbs like Nambour, Woombye, Coes Creek and Burnside sit well below the broader Coast median and attract a different buyer to the prestige coastal market. On the evidence so far, they sit on the more resilient side of that line.
I would not stretch that into a promise. It is a pattern, not a rule, and every home has its own circumstances. But it does suggest that a headline about national values falling may say very little about a particular street in Palmwoods.
Some context before anyone panics
A 0.3% monthly fall reads differently once you know what came before it.
In the first quarter of this year, Cotality had regional Queensland dwelling values up 14.7% over twelve months, with a median around $839,000. A fall of 0.3% gives back roughly what this market was adding in a fortnight last year.
That does not make it meaningless. If it repeats month after month it compounds, and I will keep reporting it if it does. But there is a real difference between a market falling from flat and a market easing after one of the strongest runs it has ever had. Almost nobody who owns a home across the hinterland is worse off than they were twelve months ago.
What this changes for buyers and sellers
Honestly, less than you might think, because the practical advice has not moved since I last wrote about it.
If you are selling, launch pricing, presentation and method of sale are still the three decisions that carry the campaign. I went through each of those in detail two weeks ago, and everything in that piece still holds. If anything, the July data reinforces it.
If you are buying, the picture is unchanged as well. More time, more choice, more room to negotiate, and a real need to confirm your borrowing capacity before you start looking rather than after, particularly if your finance is sitting close to its limit.
What has genuinely changed is a matter of framing. Two weeks ago I could tell local sellers that the national story was somebody else’s story. That is no longer quite true. It is now our story too, just a much milder version of it.
What I am watching next
Two things, and the first arrives on Tuesday.
The Reserve Bank board meets on 11 August. If you want a read on what is actually expected rather than what is being speculated about, the futures market is a better guide than the commentary. On 4 August, the ASX 30 day interbank cash rate futures contract for August was trading at 95.645. That works out to roughly a 3% chance of a rise to 4.60%.
In plain terms, the market is almost entirely convinced nothing will change on Tuesday.
That is worth understanding properly, because a hold is not the same as relief. It simply means borrowing capacity stays where it is, and where it is has already tightened considerably over the past year. The more useful part of the announcement will be the language the board uses about what comes next.
The second is the REIQ’s June quarter figures, due later this month. They will be the first official Queensland data that captures this turn properly, and unlike the national indices they break down to our region and our suburbs. I will cover them here when they arrive.
Until then, what I can tell you is what I see week to week. Buyers are still turning up and still committing. They are simply taking longer, asking sharper questions, and walking away from anything priced on last year’s expectations. Well presented homes at sensible numbers are still finding their buyer without much fuss.
That is a market adjusting, not a market in trouble.
If you would like a straight read on where your own property sits after all this, rather than where it sat a year ago, feel free to get in touch. Happy to have a no pressure conversation and give you an honest answer either way.
Get in touch with us today and and let’s give you fantastic results that you deserve.
SUBSCRIBE to stay up to date with all the latest property insights and news.
Click Here to Subscribe
The Sunshine Coast Seller’s Guide to Choosing the Right Agent
Get Your Free Guide Here
Just Listed Your Home? Here’s What Happens Next (And How to Get Ready for a Great Result)
Download the Guide Here
Data sources: Cotality Home Value Index, July 2026, released 3 August 2026; Cotality regional Queensland market data, Q1 2026; ASX 30 Day Interbank Cash Rate Futures, August 2026 contract, as at 4 August 2026; Reserve Bank of Australia. Figures were current at the time of writing and are general in nature. This is not personal financial or property advice.